Item Analysis
The Items Analysis tool provides a performance overview of your inventory items. Use it to evaluate what’s selling well and what’s not and to help guide pricing, stock, and promotional decisions. Items Analysis is available in the Enterprise Edition and higher.
To view the Item Analysis:
-
Go to the Sell Items mode.
-
Click the Analysis button on the ribbon bar.
-
Select Items Analysis from the drop-down menu.
Working with the Item Analysis Grid:
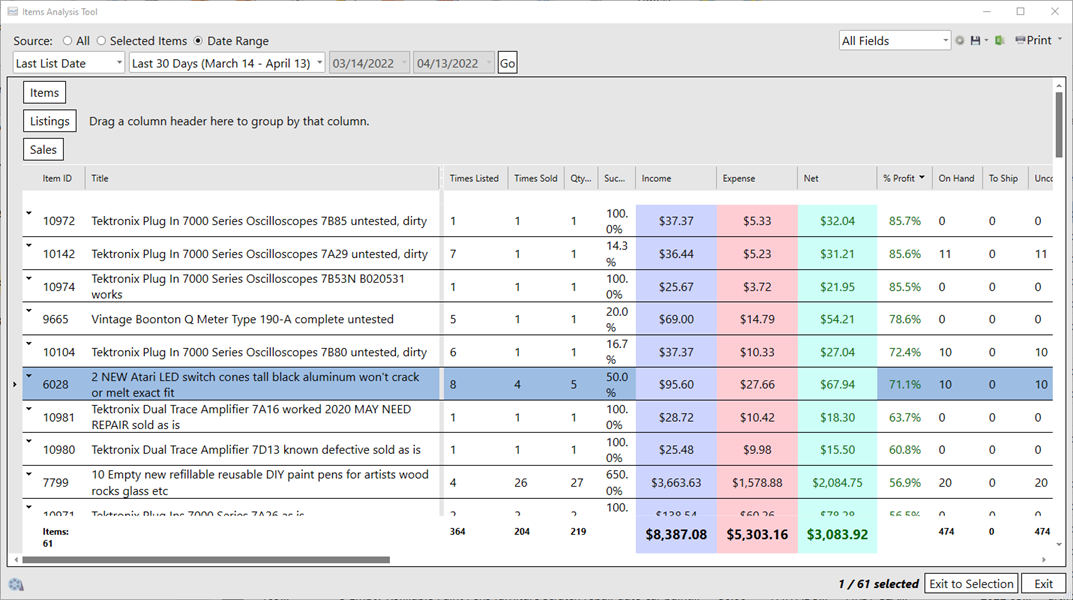
In the upper-left corner of the Item Analysis grid, use the Source setting to define which data you want to analyze. If you choose Date Range, the default is the last 30 days, but that can be customized. You can also analyze specific listings by highlighting them in the Sell Items grid, then opening the Item Analysis window and setting the Source to Selected Items. If you want to evaluate everything in your database, switch the Source to All Items.
The Item Analysis grid includes a number of predefined views designed to help sellers quickly evaluate their inventory's performance. These views are accessible through the Views drop-down located on the upper right corner above the grid. Each predefined view offers a different lens for analyzing your items. Some focus on sales volume, profitability, or sell-through rates, while others help identify items with low activity or aging inventory. These can be a great starting point for making pricing decisions or deciding which items to restock or discontinue.
|
Item Analysis Grid Views |
Use if for... |
| All Fields | Displays every available field without filtering or grouping. |
| Item Performance | Shows basic performance statistics per item. |
| Item Performance by Folder | Groups performance data by the folder the item is in. |
| Item Performance by Profile | Groups performance data by the folder the item is in. |
| Highest Grossing | Sorts items by the highest gross revenue. |
| Highest Profit | Displays items ordered by total profit. |
| Most Successful | Shows items with the highest success rate based on listing-to-sale conversion. |
| Most Often Listed | Sorts by the number of times an item has been listed. |
| Most Often Sold | Displays items sold most frequently. |
| Most Quantity Sold | Lists items with the highest total quantity sold. |
Mastering the grid layout in Item Analysis can help you uncover trends and make smarter inventory decisions. For a deeper look at customizing columns, filters, grouping, and layouts, visit: Working with Grids