Supplier Analysis
The Supplier Analysis Tool provides insight into supplier performance based on your purchase history in SixBit. Whether you want to identify your top vendors, analyze order trends, or retrieve supplier contact information, this tool brings key supplier data into one centralized view.
To view the Supplier Analysis:
-
Go to the Sell Items mode.
-
Click the Analysis button on the ribbon bar.
-
Select Supplier Analysis from the drop-down menu.
Working with the Supplier Analysis Grid:
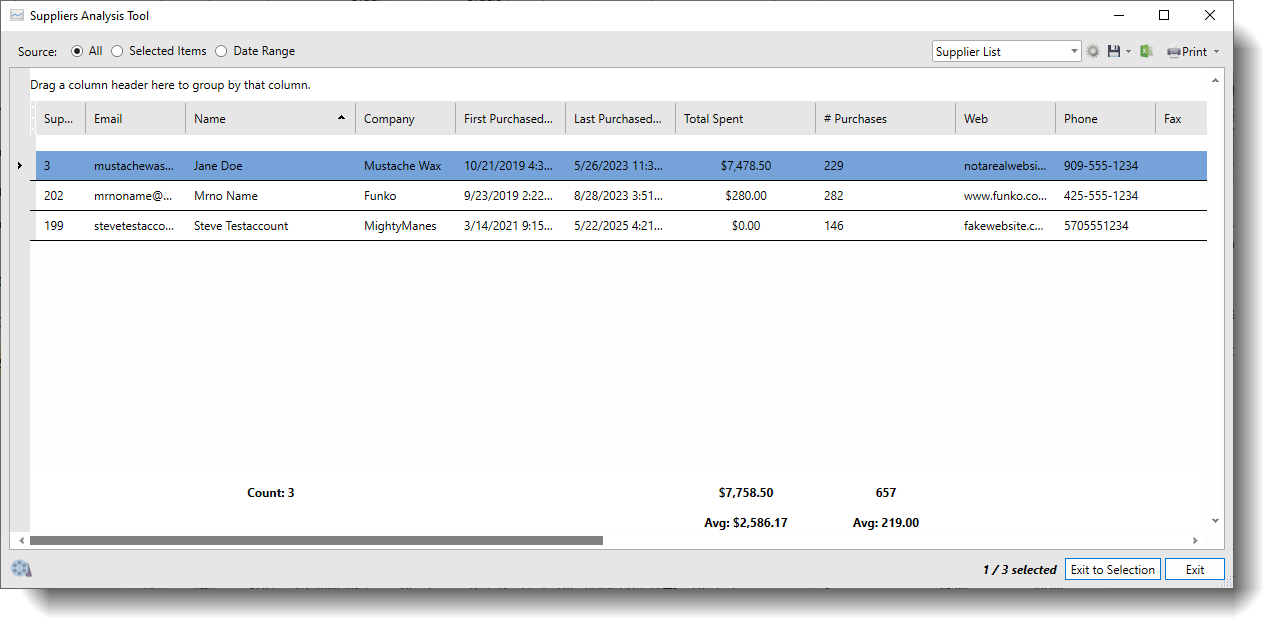
The Supplier Analysis Tool displays supplier records in a customizable grid, allowing you to examine purchasing activity and identify patterns in your sourcing history. At the top of the screen, you will find the Source options, which control which suppliers are included in your results. You can choose to view All suppliers, limit the grid to Selected Items from your inventory, or filter using a Date Range.
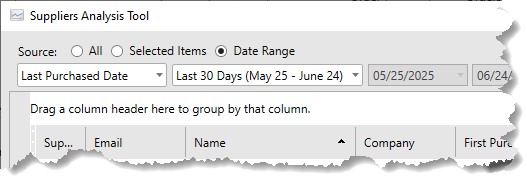
When the Date Range option is selected, you can refine results even further by choosing whether to filter by First Purchased Date or Last Purchased Date. This is useful if you want to focus only on recent suppliers or review older relationships. You can enter your own start and end dates or select from common predefined ranges, such as “Last 30 Days,” to update the grid automatically.
Each row in the grid represents one supplier and includes key fields like Name, Company, Email, First Purchased, Last Purchased, Total Spent, and Number of Purchases. These columns appear by default, but you can customize the display using the Column Chooser. To do this, right-click on any column header and select from the full list of available fields. This allows you to include additional data such as phone numbers, addresses, or notes, depending on what details are relevant to your analysis.
You can also apply one of several built-in grid layouts using the drop-down in the upper-right corner. These views automatically adjust the columns and sorting to highlight different aspects of supplier activity. For example, Biggest Supplier by Amount Spent ranks vendors by total purchase value, while Recent Purchases places your latest supplier activity at the top. Other views are available for generating an Email List, a Mailing List, or grouping suppliers by State or Country.
At the bottom of the Suppliers Analysis grid, SixBit displays a running total and average for the amount spent and the number of purchases. These values update dynamically based on the current filters or view, providing a quick way to summarize your supplier data.
For more detailed information on how to sort, group, or search within the grid, please refer to our Working with Grids guide.