Analysis Tool
Users subscribed to the Enterprise Edition and above have access to the Analysis tools. Analysis tools can be used to track sales and listing activity over a given period of time, as well as cost of inventory and buyers. Analysis tools differ from reports in that they can be customized to deliver the data businesses want to see. There are multiple Analysis tools available in SixBit depending on which mode the user is currently in. In the Sell Items mode, users have access to Item Analysis, Cost of Inventory Report, Consignor Analysis (for users that have the Consigment module added on to their SixBit account) and Supplier Analysis. In the Check Listings mode we have Listings Analysis, and in the Ship Orders mode we have the Orders Analysis, Shipments Analysis, Sales Analysis, and Buyers Analysis.
To open the Analysis window, in SixBit go to Sell Items, Check Listings, or Ship Orders, and click the Analysis button in the ribbon bar. For this example we will use the Items Analysis found in the Sell Items mode:
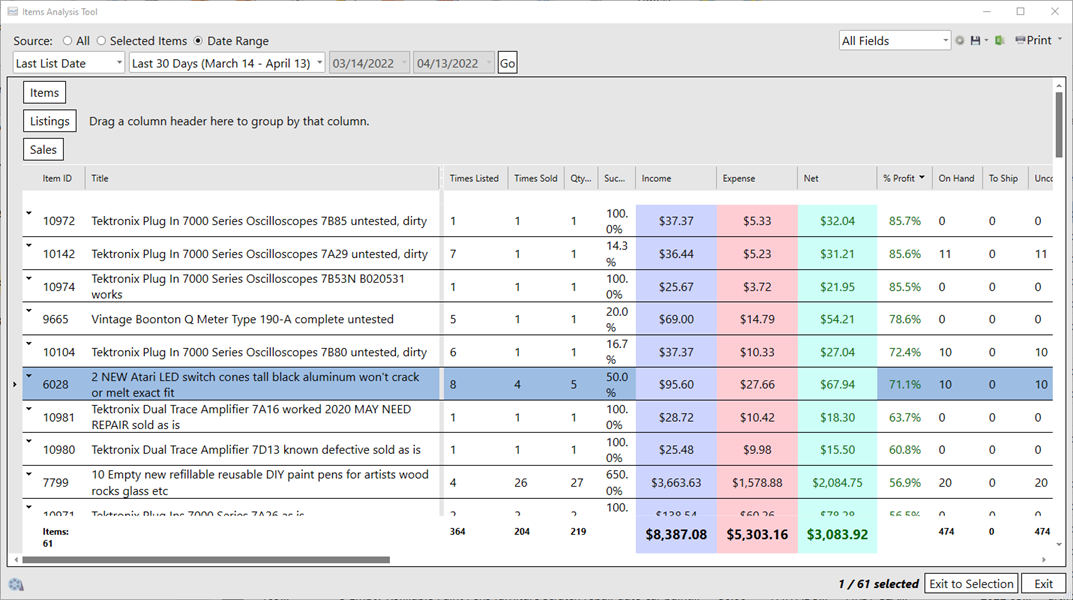
The above image shows item performance over the last 30 days, using the Date Range source. For Source, users can also select specific items and set the source to Selected Items to just see analysis on those items. The analysis can be customized the same way the main grid can, show/hide fields by right-clicking the column header, sorting on fields, and grouping (recommend not changing the default grouping but you are welcome to). Analyses can be exported to Excel or CSV by clicking the Excel button, or printed directly using the Print button.